Data Visualisation and How Business Analysts Use It
Introduction
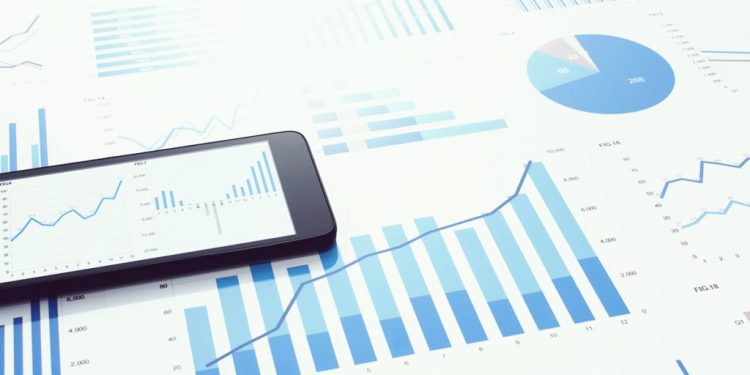
Data Visualisation is the graphical representation of information and data. By using visual elements like charts, graphs, and maps, data visualisation tools provide an accessible way to see and understand trends, outliers, and patterns in data. In a business analysis course, learners are taught to translate complex data sets into actionable insights by using data visualisation.
Importance of Data Visualisation
Here is why data visualisation is a crucial application in business analysis.
Simplifies Complex Data: Data visualisation helps in simplifying complex data sets, making it easier for stakeholders to understand the information.
Identifies Trends and Patterns: Visual tools can quickly highlight trends, correlations, and patterns that might be missed in text-based data.
Enhances Data Storytelling: Visuals help tell a compelling story with data, making presentations and reports more engaging and informative.
Improves Decision Making: By presenting data visually, business analysts can help decision-makers grasp insights faster and make informed decisions.
Encourages Data Exploration: Interactive visualisations allow users to explore the data themselves, uncovering insights and asking new questions.
Common Data Visualisation Tools
Some of the common tools used for data visualisation in business analysis are described here. These tools are generally covered in any business analysis course.
Tableau: Known for its powerful data visualisation capabilities and ease of use.
Power BI: Microsoft’s business analytics tool that provides interactive visualisations and business intelligence capabilities.
Excel: Widely used for creating various types of charts and graphs.
QlikView/Qlik Sense: Business intelligence tools that offer robust visualisation features.
Google Data Studio: A free tool that turns data into informative, easy-to-read, customisable dashboards and reports.
Common Types of Data Visualisations
The following are the common types of data visualisation tools.
Bar Charts: Used to compare different categories or groups.
Line Charts: Ideal for showing trends over time.
Pie Charts: Show proportions and percentages of a whole.
Scatter Plots: Display relationships between two variables.
Heat Maps: Show data density or intensity using colour.
Histograms: Display the distribution of a dataset.
Geographical Maps: Visualise data across different geographical locations.
How Business Analysts Use Data Visualisation:
Data visualisation is widely used by business analysts. It is the success of data visualisation in enhancing business performance that makes it a topic covered in any business analyst course.
Reporting and Dashboards:
- Real-Time Dashboards: Business analysts create real-time dashboards to monitor key performance indicators (KPIs) and metrics.
- Executive Reports: Visualisations are used in executive reports to provide a clear and concise overview of business performance.
Trend Analysis:
- Sales Trends: Line charts and bar graphs are used to analyse sales trends over time.
- Customer Behaviour: Heat maps and scatter plots help in understanding customer behaviour patterns.
Data Exploration:
- Interactive Visualisations: Tools like Tableau and Power BI offer interactive visualisations that allow analysts to drill down into the data and explore different dimensions.
- Hypothesis Testing: Visual tools help in testing hypotheses and validating assumptions.
Presenting Findings:
- Storytelling with Data: Business analysts use visualisations to tell compelling stories during presentations, making complex data more understandable for stakeholders.
- Highlighting Key Insights: Visuals are used to highlight key insights and findings, making it easier for decision-makers to grasp important points.
Identifying Opportunities and Risks:
- Opportunity Identification: Visualisations help in identifying growth opportunities by highlighting positive trends and successful areas.
- Risk Management: Negative trends and potential risks can be quickly identified and addressed.
Example of Data Visualisation Use
Data visualisation is best learned by following examples of its usage in real-world scenarios. A role-based business analysis course will cover data visualisation from the perspective of its applications taught as examples. A business analyst at a retail company might use data visualisation to analyse sales performance across different regions. By using a combination of bar charts, line graphs, and geographical maps, the analyst can:
Compare Sales Performance: Use bar charts to compare sales performance across different regions.
Identify Trends: Use line graphs to identify sales trends over time, such as seasonal peaks and troughs.
Geographical Insights: Use geographical maps to visualise sales density and identify high-performing and low-performing areas.
These visualisations enable the analyst to present clear and actionable insights to the sales team and management, helping them make data-driven decisions to improve sales strategies and allocate resources more effectively.
Conclusion
In summary, data visualisation is a vital tool for business analysts, enabling them to transform complex data into meaningful insights and drive better business outcomes through clear, visual communication. For business professionals, completing an up-to-date business analysis course that covers data visualisation would mean empowerment that will help them excel in their careers.
Business Name: ExcelR- Data Science, Data Analytics, Business Analyst Course Training Mumbai
Address: Unit no. 302, 03rd Floor, Ashok Premises, Old Nagardas Rd, Nicolas Wadi Rd, Mogra Village, Gundavali Gaothan, Andheri E, Mumbai, Maharashtra 400069, Phone: 09108238354, Email: enquiry@excelr.com.